FlightRecord

Is your flight usually on time?

Reliability statistics for every US route, airport, and airline — computed from 14,739,704 official US DOT flight records, not reviews or guesswork.

Data through July 2026

78%
US flights on time
17 min
avg arrival delay
1.6%
flights cancelled
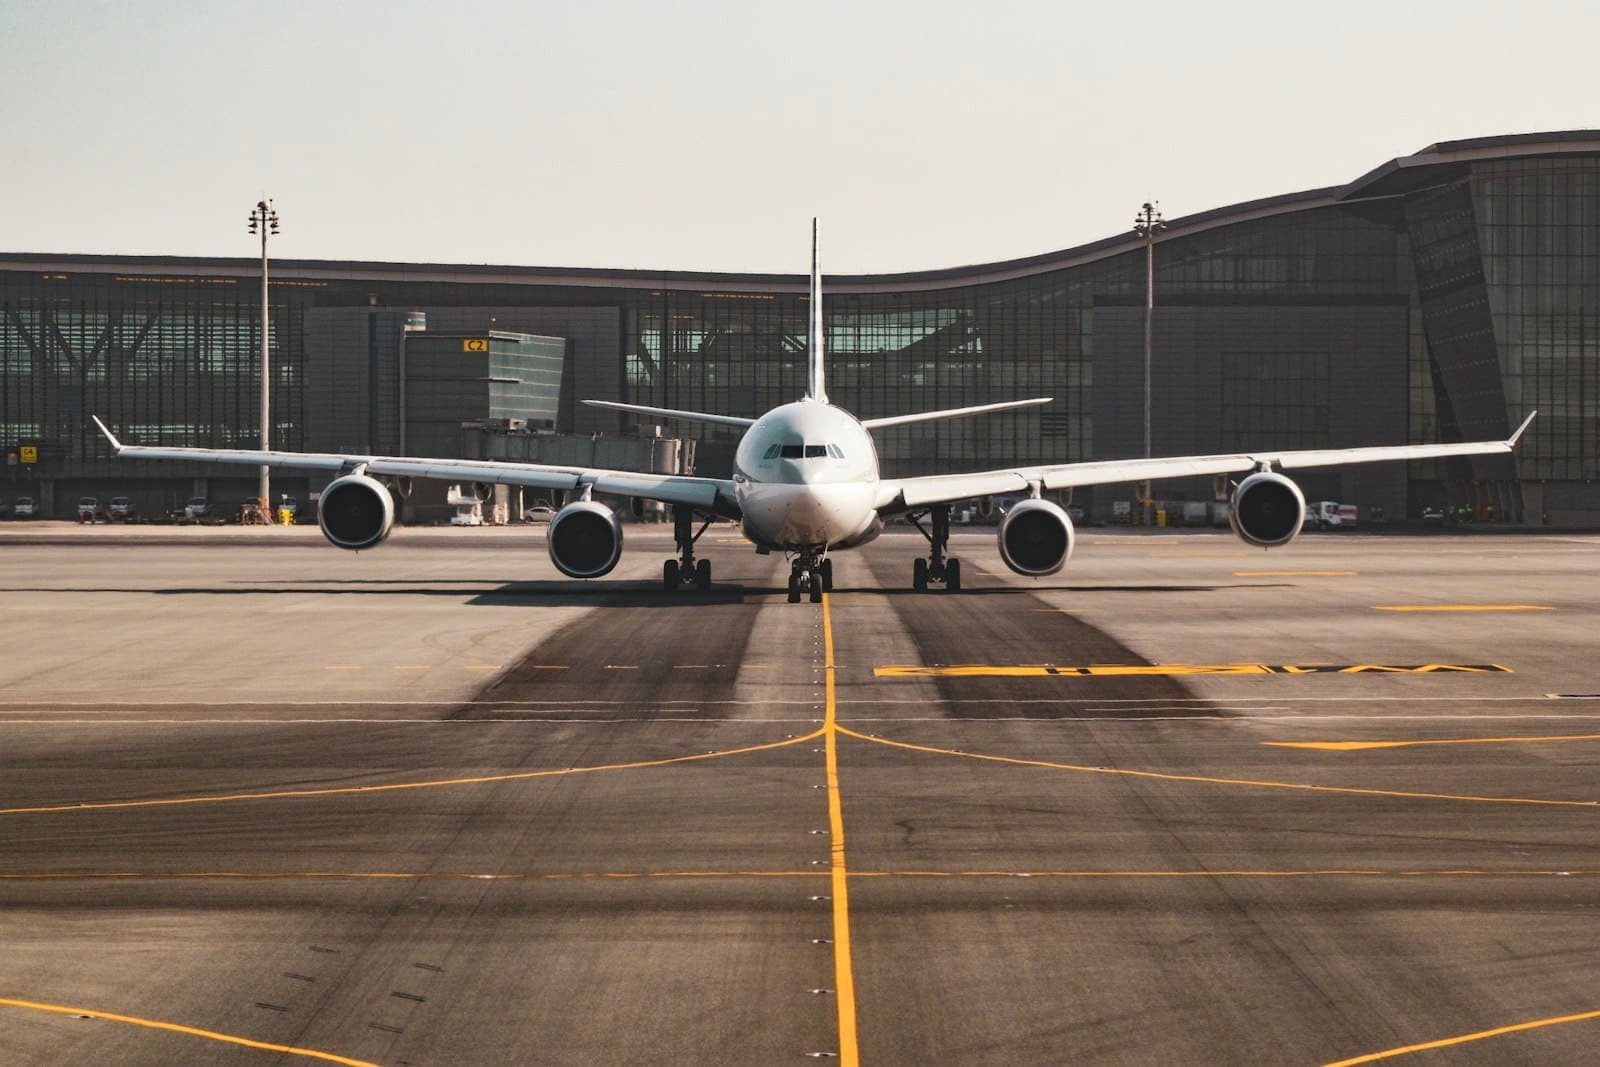
Widebody jet taxiing along the taxiway centerline toward the runway, terminal behind it
Pushback to wheels-up: where a schedule is kept or lost. Photo: Unsplash

Busiest US routes

  1. ORD → LGA11,611/yr71%
  2. LGA → ORD11,611/yr72%
  3. SFO → LAX11,235/yr77%
  4. LAX → SFO11,235/yr70%
  5. LAX → JFK10,284/yr80%
  6. JFK → LAX10,281/yr80%
  7. OGG → HNL10,075/yr88%
  8. HNL → OGG10,072/yr88%
  9. BOS → DCA9,092/yr76%
  10. DCA → BOS9,090/yr75%

Busiest airports

  1. ORD — Chicago75%
  2. DEN — Denver76%
  3. ATL — Atlanta78%
  4. DFW — Dallas/Fort Worth72%
  5. PHX — Phoenix79%
  6. LAX — Los Angeles81%
  7. CLT — Charlotte75%
  8. LAS — Las Vegas76%
  9. SEA — Seattle79%
  10. MCO — Orlando75%

All airports →

Airline on-time rankings

  1. 1.Hawaiian Airlines84%
  2. 2.Endeavor Air84%
  3. 3.Delta Air Lines81%
  4. 4.Republic Airways80%
  5. 5.Envoy Air80%
  6. 6.SkyWest Airlines79%
  7. 7.United Airlines79%
  8. 8.Alaska Airlines78%
  9. 9.Southwest Airlines78%
  10. 10.Spirit Airlines76%
  11. 11.Allegiant Air75%
  12. 12.American Airlines74%
  13. 13.PSA Airlines74%
  14. 14.JetBlue Airways73%
  15. 15.Frontier Airlines72%

All rankings →